Bitcoin's price chart is one of the strangest graphs in financial history — long stretches of near-zero followed by explosive climbs, brutal corrections, and slow rebuilds. Looking at the milestones in order is the fastest way to understand why holding Bitcoin yields wildly different "purchasing power" over time.
The early years: pizza, pennies, and proof of concept
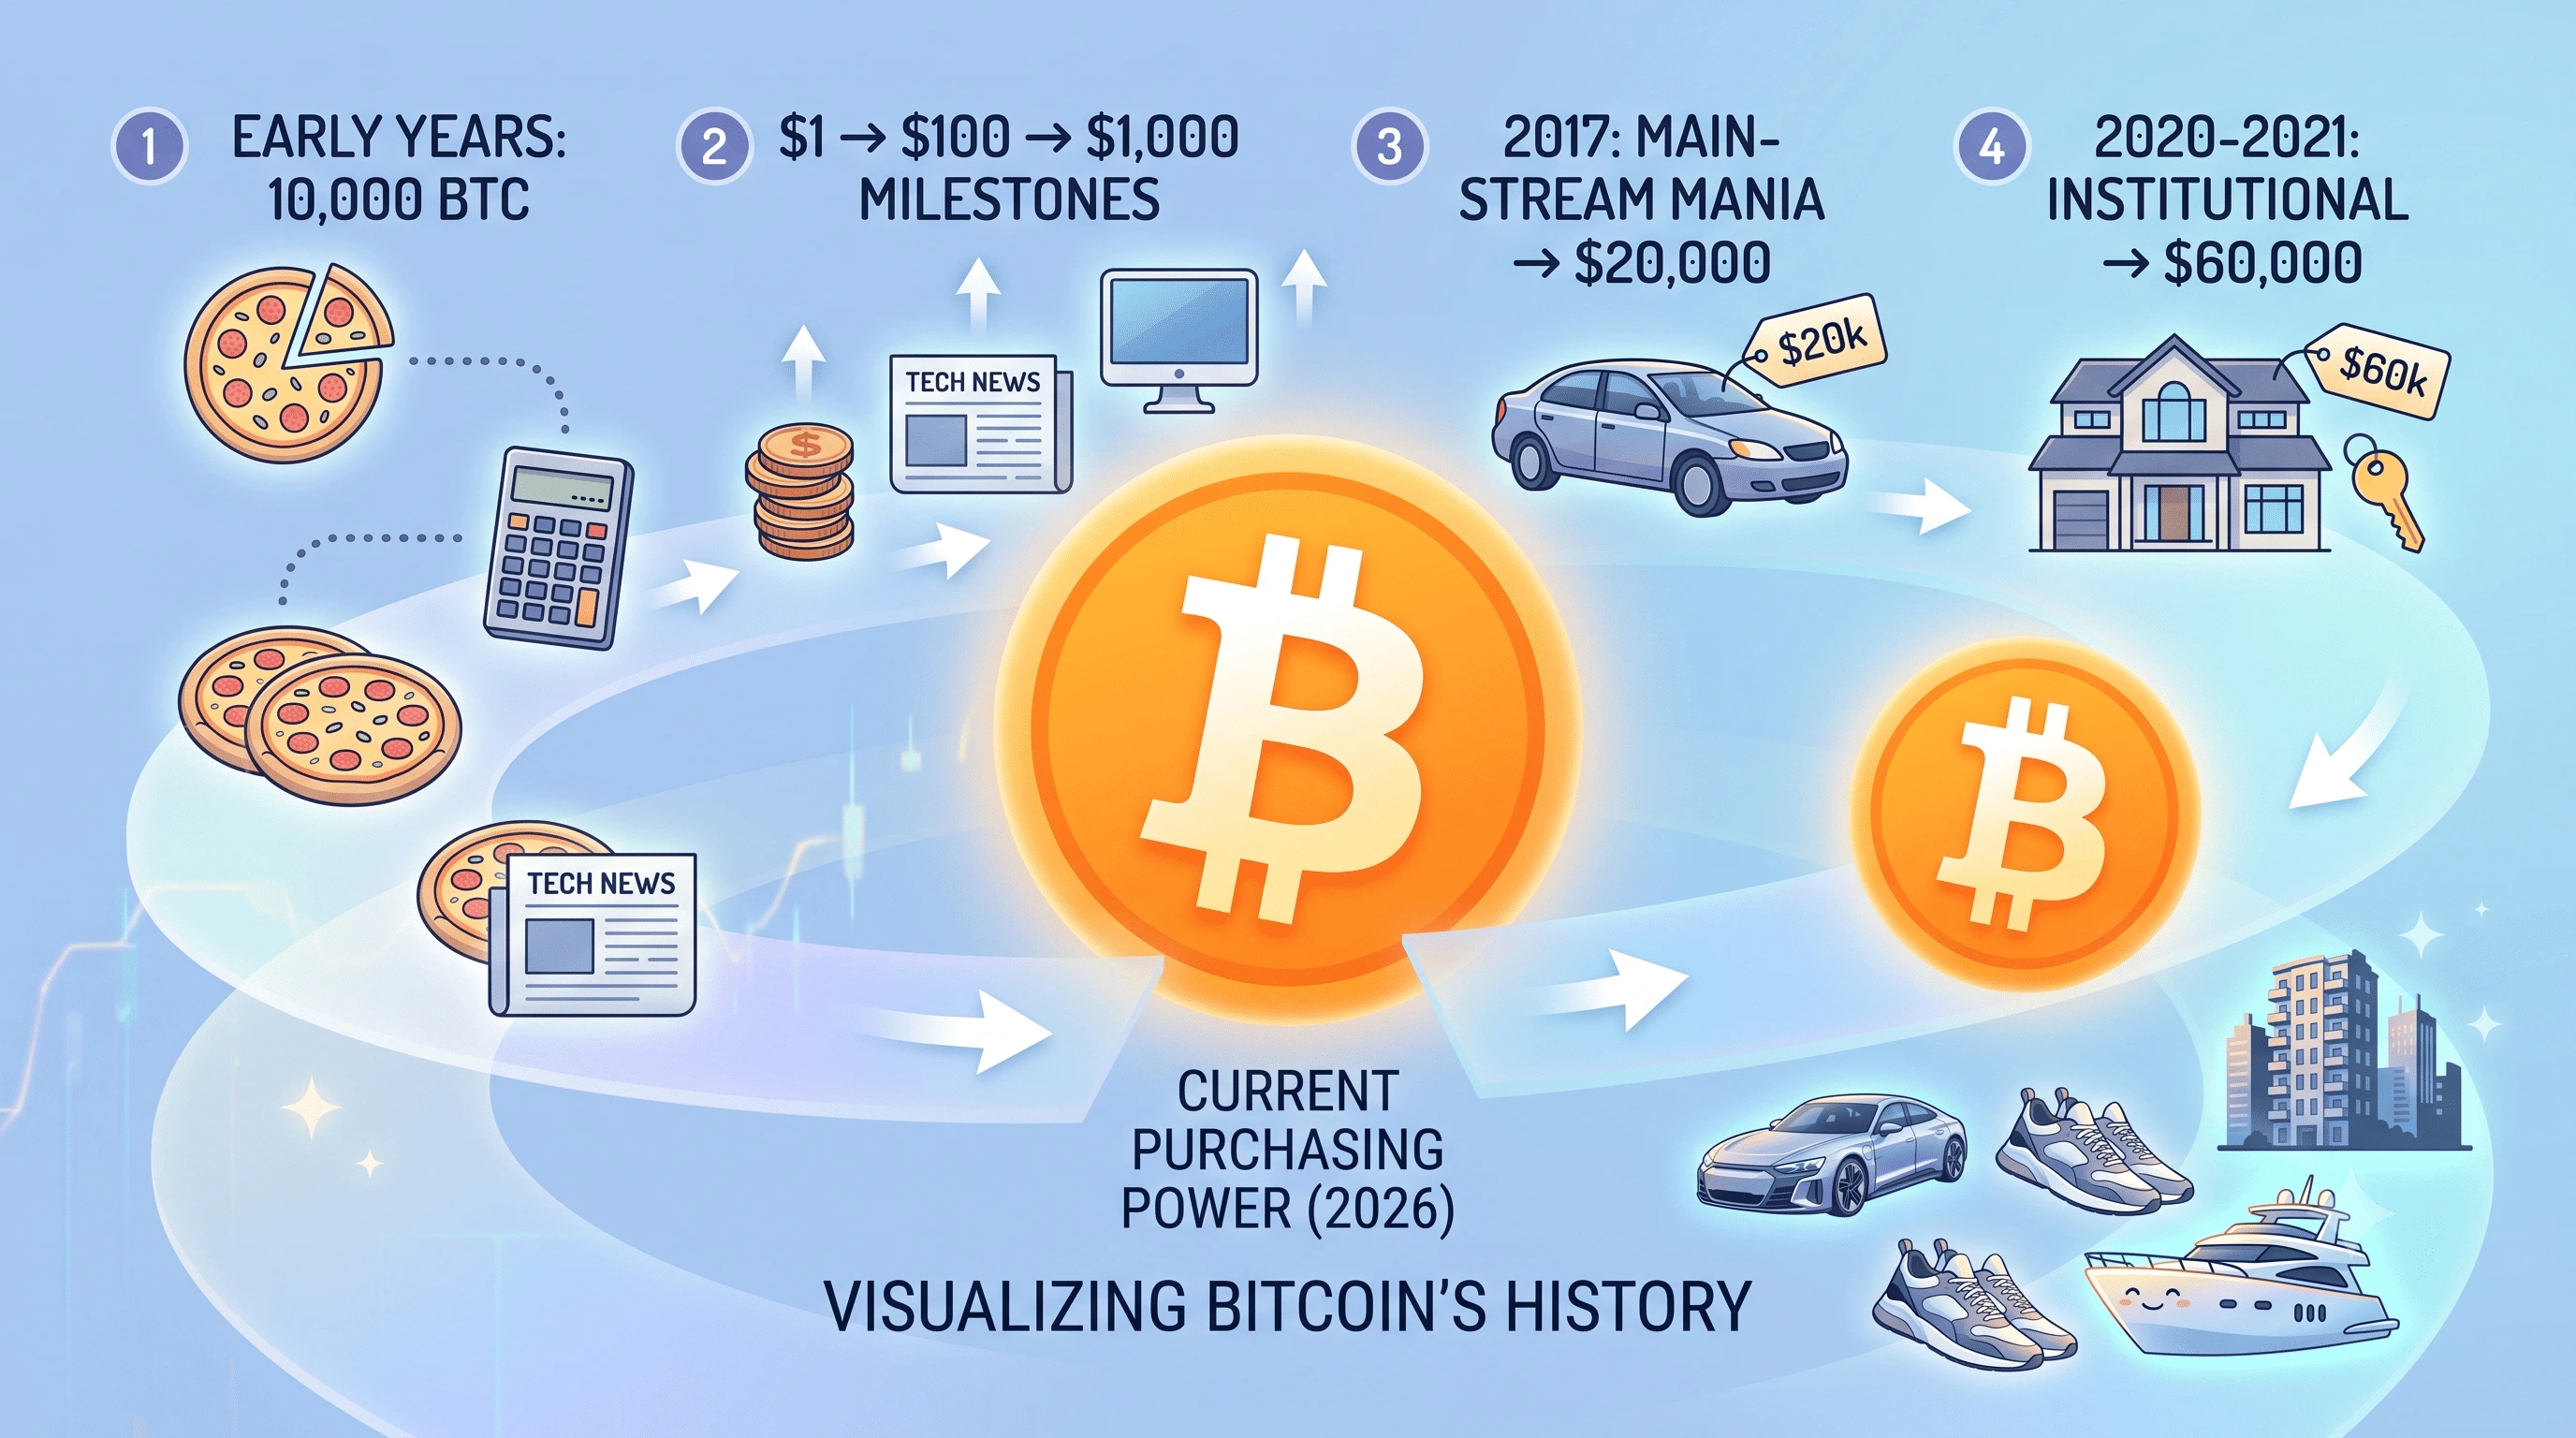
Bitcoin traded for a fraction of a cent in its earliest days. The most famous transaction in its history — 10,000 BTC for two pizzas in 2010 — is now the standard reference point for asset trajectory. At the time, that amount bought dinner. Today, the same coin count would buy a fleet of private jets many times over.
First real price discovery: reaching $1, then $100
Bitcoin crossed $1 in 2011, drawing its first wave of tech-press attention. By late 2013, it crossed $1,000, driven by growing exchange volume and early adoption in countries facing currency instability. Few outlets seriously discussed what "1 BTC" could buy in real goods back then, as a spending ecosystem barely existed.
The 2017 run and first mainstream mania
Bitcoin's climb toward $20,000 in late 2017 brought the asset to dinner-table conversations. A single coin, worth a few hundred dollars just years earlier, was suddenly worth a small car. The subsequent crash through 2018 erased a large share of that purchasing power just as quickly.
Simulate Historic Holdings
See what various Bitcoin amounts buy using live market data today.
Try Simulator →2020–2021: institutional entry and high-water marks
The 2020–2021 cycle featured public corporations adding Bitcoin to balance sheets, pushing prices past $60,000. At that peak, a single Bitcoin's purchasing power moved from "car" territory into genuine "down payment on a house" territory in many markets.
The corrections: why milestones cut both ways
Every major upward milestone has been followed by a significant drawdown — often 50% or more from the peak. The same coin that covered a down payment at the top of a cycle might only cover a used car a year later, even if your total coin count never changed.
What the pattern actually teaches
Zooming out across every cycle reveals a consistent pattern: sharp climbs, sharp corrections, and higher historical lows over multi-year windows. Purchasing power tied to Bitcoin is not a stable, slowly-appreciating line — it moves in steps in either direction.
Feel the milestones, don't just read them
Plugging a fixed coin amount into a live purchasing-power tool helps visualize how that balance shoppers today versus historic targets. Head over to the SpendCoins simulator to test your own portfolio figures.