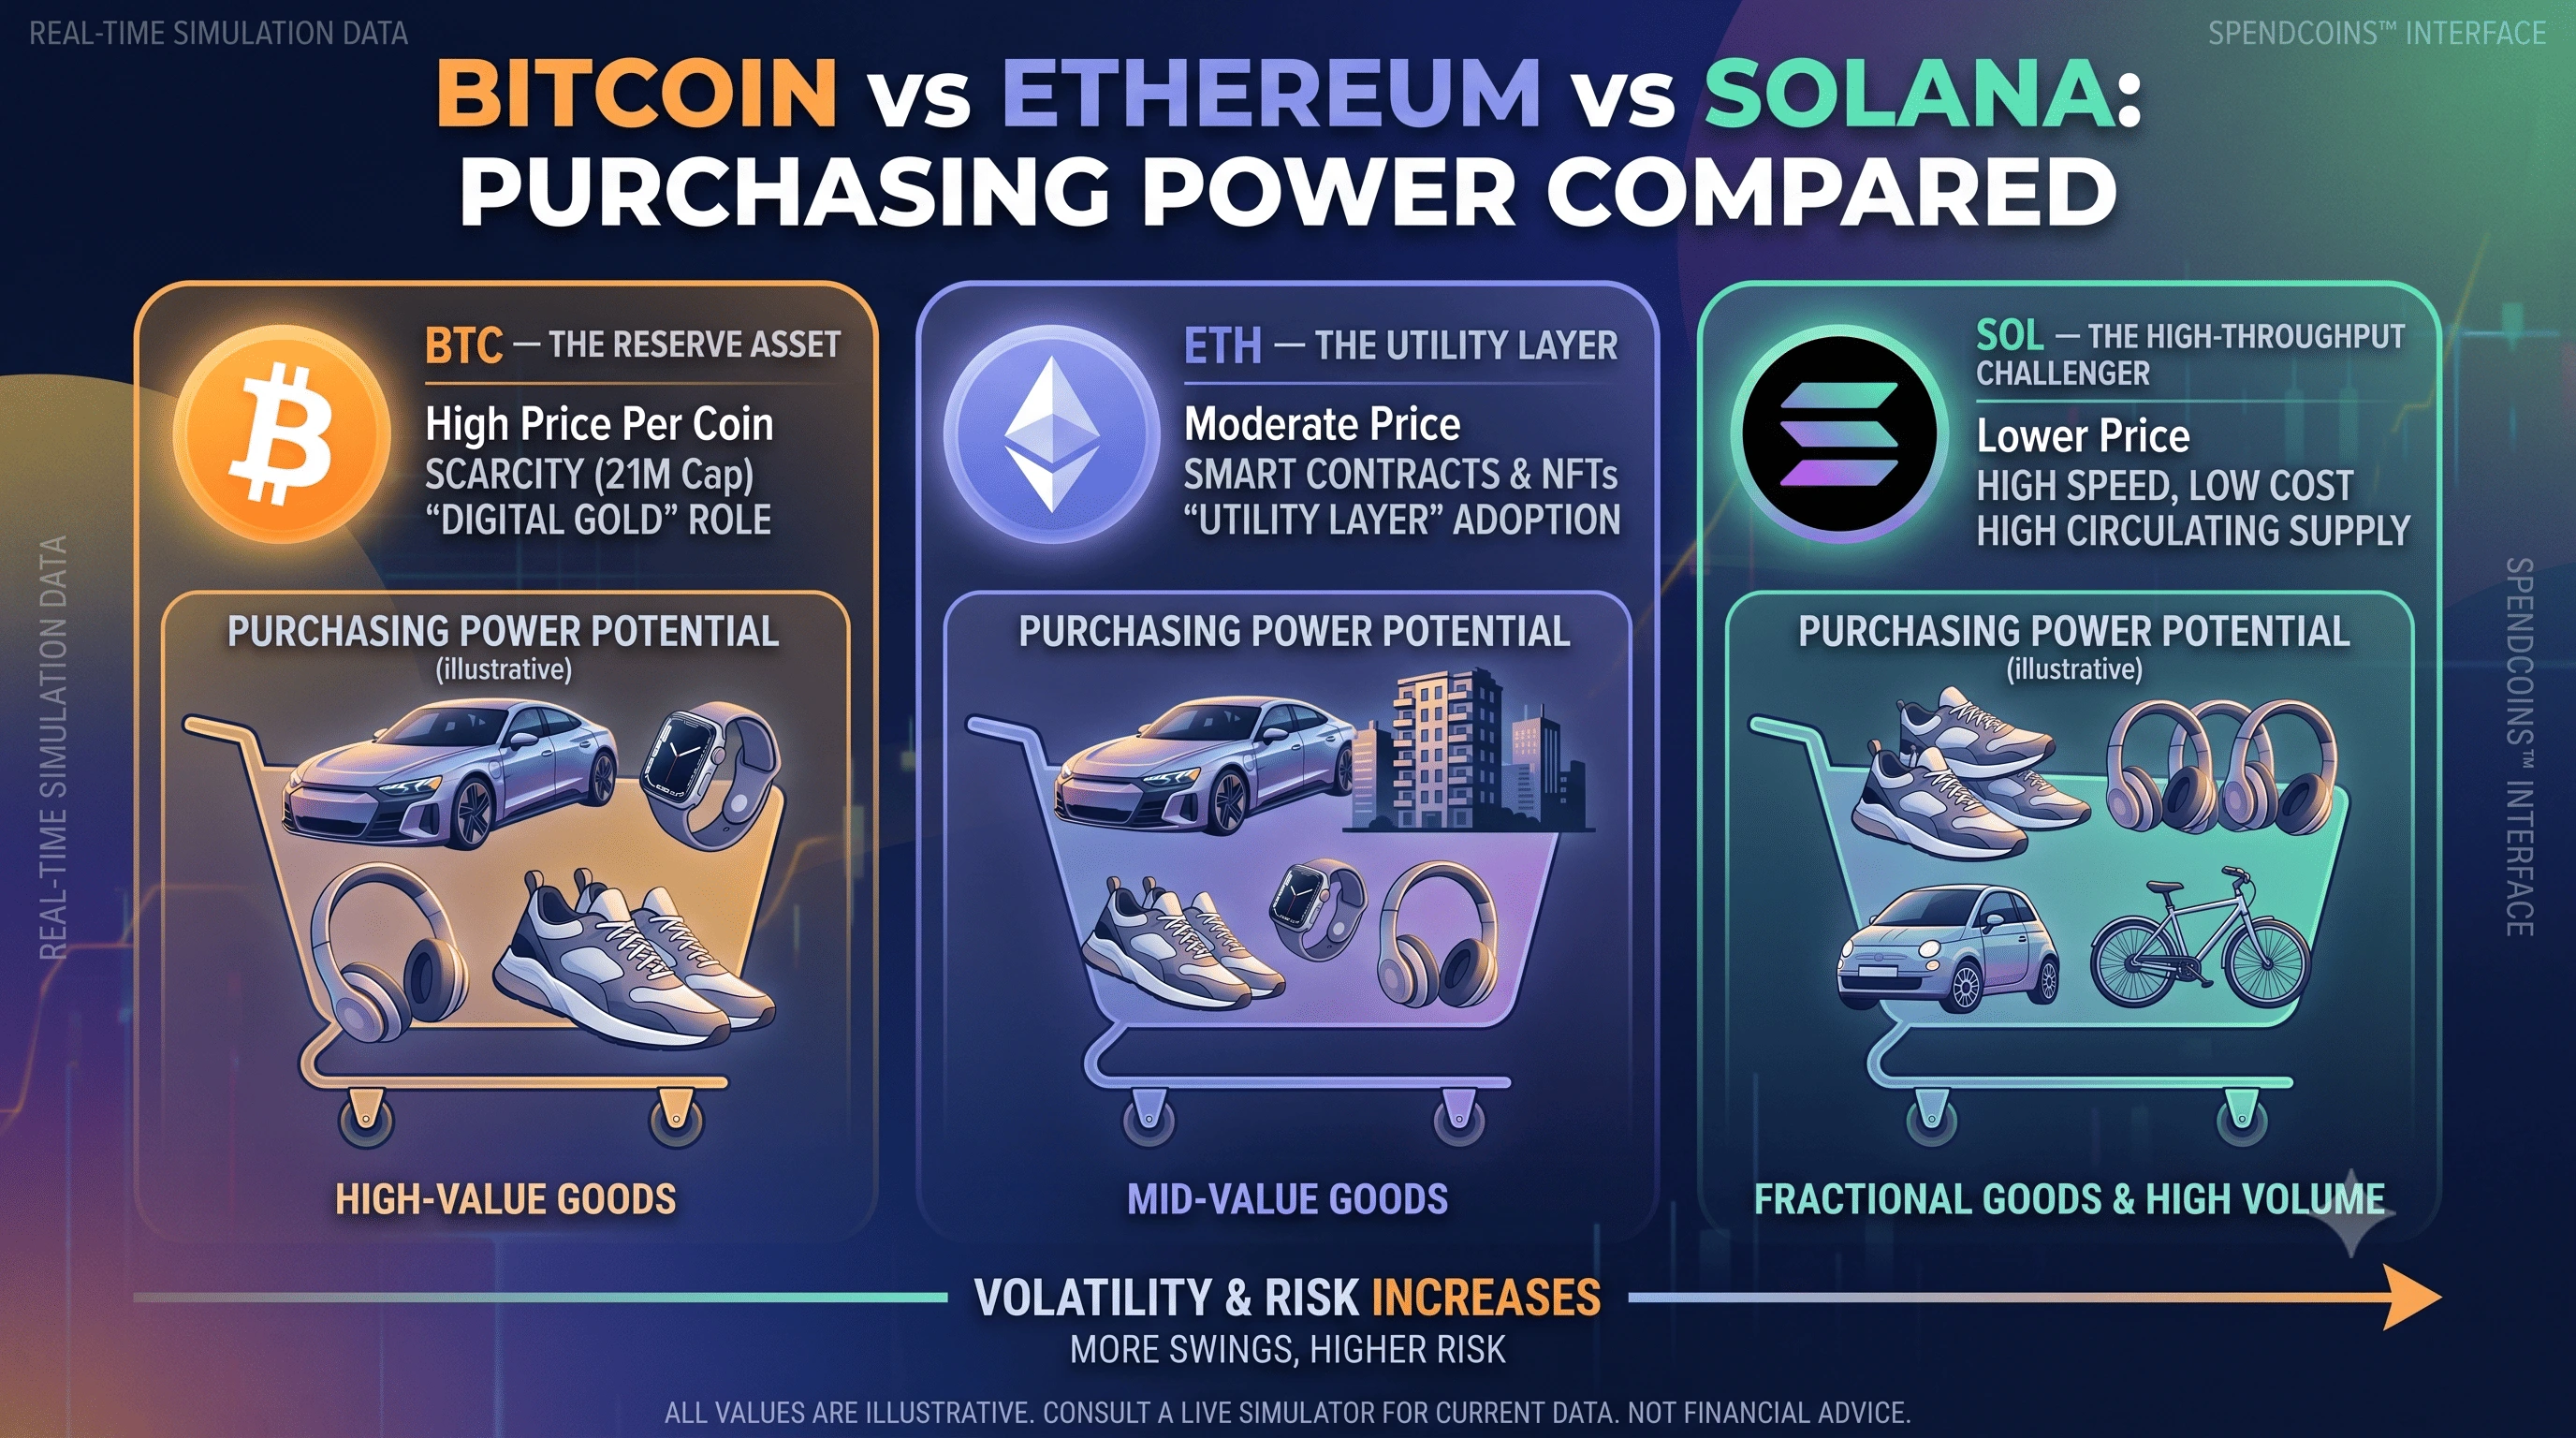
Not all cryptocurrencies are created equal, and nowhere is that clearer than when you put their purchasing power side by side. A dollar figure alone doesn't tell you much — but watching how far a fixed amount of BTC, ETH, or SOL stretches at the checkout counter tells a much richer story about each coin's role in the market.
The three profiles
- Bitcoin (BTC) — the reserve asset: Bitcoin trades on scarcity and first-mover status: a fixed supply cap of 21 million coins and roughly a decade and a half of market history. Its price per coin tends to be the highest of the major cryptocurrencies, which is why "spending 1 BTC" and "spending 1 SOL" put you in completely different shopping tiers.
- Ethereum (ETH) — the utility layer: Ethereum's value is tied less to "digital gold" narratives and more to its role as the settlement layer for smart contracts, NFTs, and decentralized applications. Its price sits well below Bitcoin's, but its ecosystem usage sets a unique purchasing profile.
- Solana (SOL) — the high-throughput challenger: Solana was built for speed and low transaction costs. A single SOL buys a fraction of what a single BTC does — which is exactly why "coin count" is a misleading way to compare wealth. Ten Bitcoin and ten Solana are not remotely the same amount of money.
Why comparing "1 coin" is a trap — and what to compare instead
New crypto users often assume that owning "more coins" means owning more wealth. It doesn't. What matters is total value: price per coin multiplied by quantity held. This is one of the clearest lessons the SpendCoins simulator surfaces — switch the same dollar amount between BTC, ETH, and SOL, and the coin count changes dramatically, but the shopping cart barely moves.
The more useful comparison is: for the same dollar budget, which coin has historically been more volatile, and how has that volatility affected what that budget could buy over time?
Volatility and what it means for your cart
Bitcoin tends to have the lowest relative volatility among major cryptocurrencies. Ethereum typically sits in the middle, tracking macro moves alongside ecosystem growth. Solana and higher-beta altcoins tend to swing hardest in both directions.
Translated into shopping terms: the same $50,000 position might comfortably cover a luxury car in BTC, hover near that same tier in ETH, and swing between "sports car" and "economy car" territory in SOL depending on market conditions.
A quick mental model
- BTC: Store-of-value comparisons, long time horizons, lower (relative) volatility.
- ETH: Ecosystem and utility exposure, moderate volatility.
- SOL: High growth potential, highest volatility, most dramatic purchasing-power swings.
See it live
Numbers and volatility profiles shift constantly, so the most accurate way to compare them is in real time. Open the SpendCoins simulator, enter the same dollar-equivalent amount across BTC, ETH, and SOL, and watch how differently each one fills your cart.