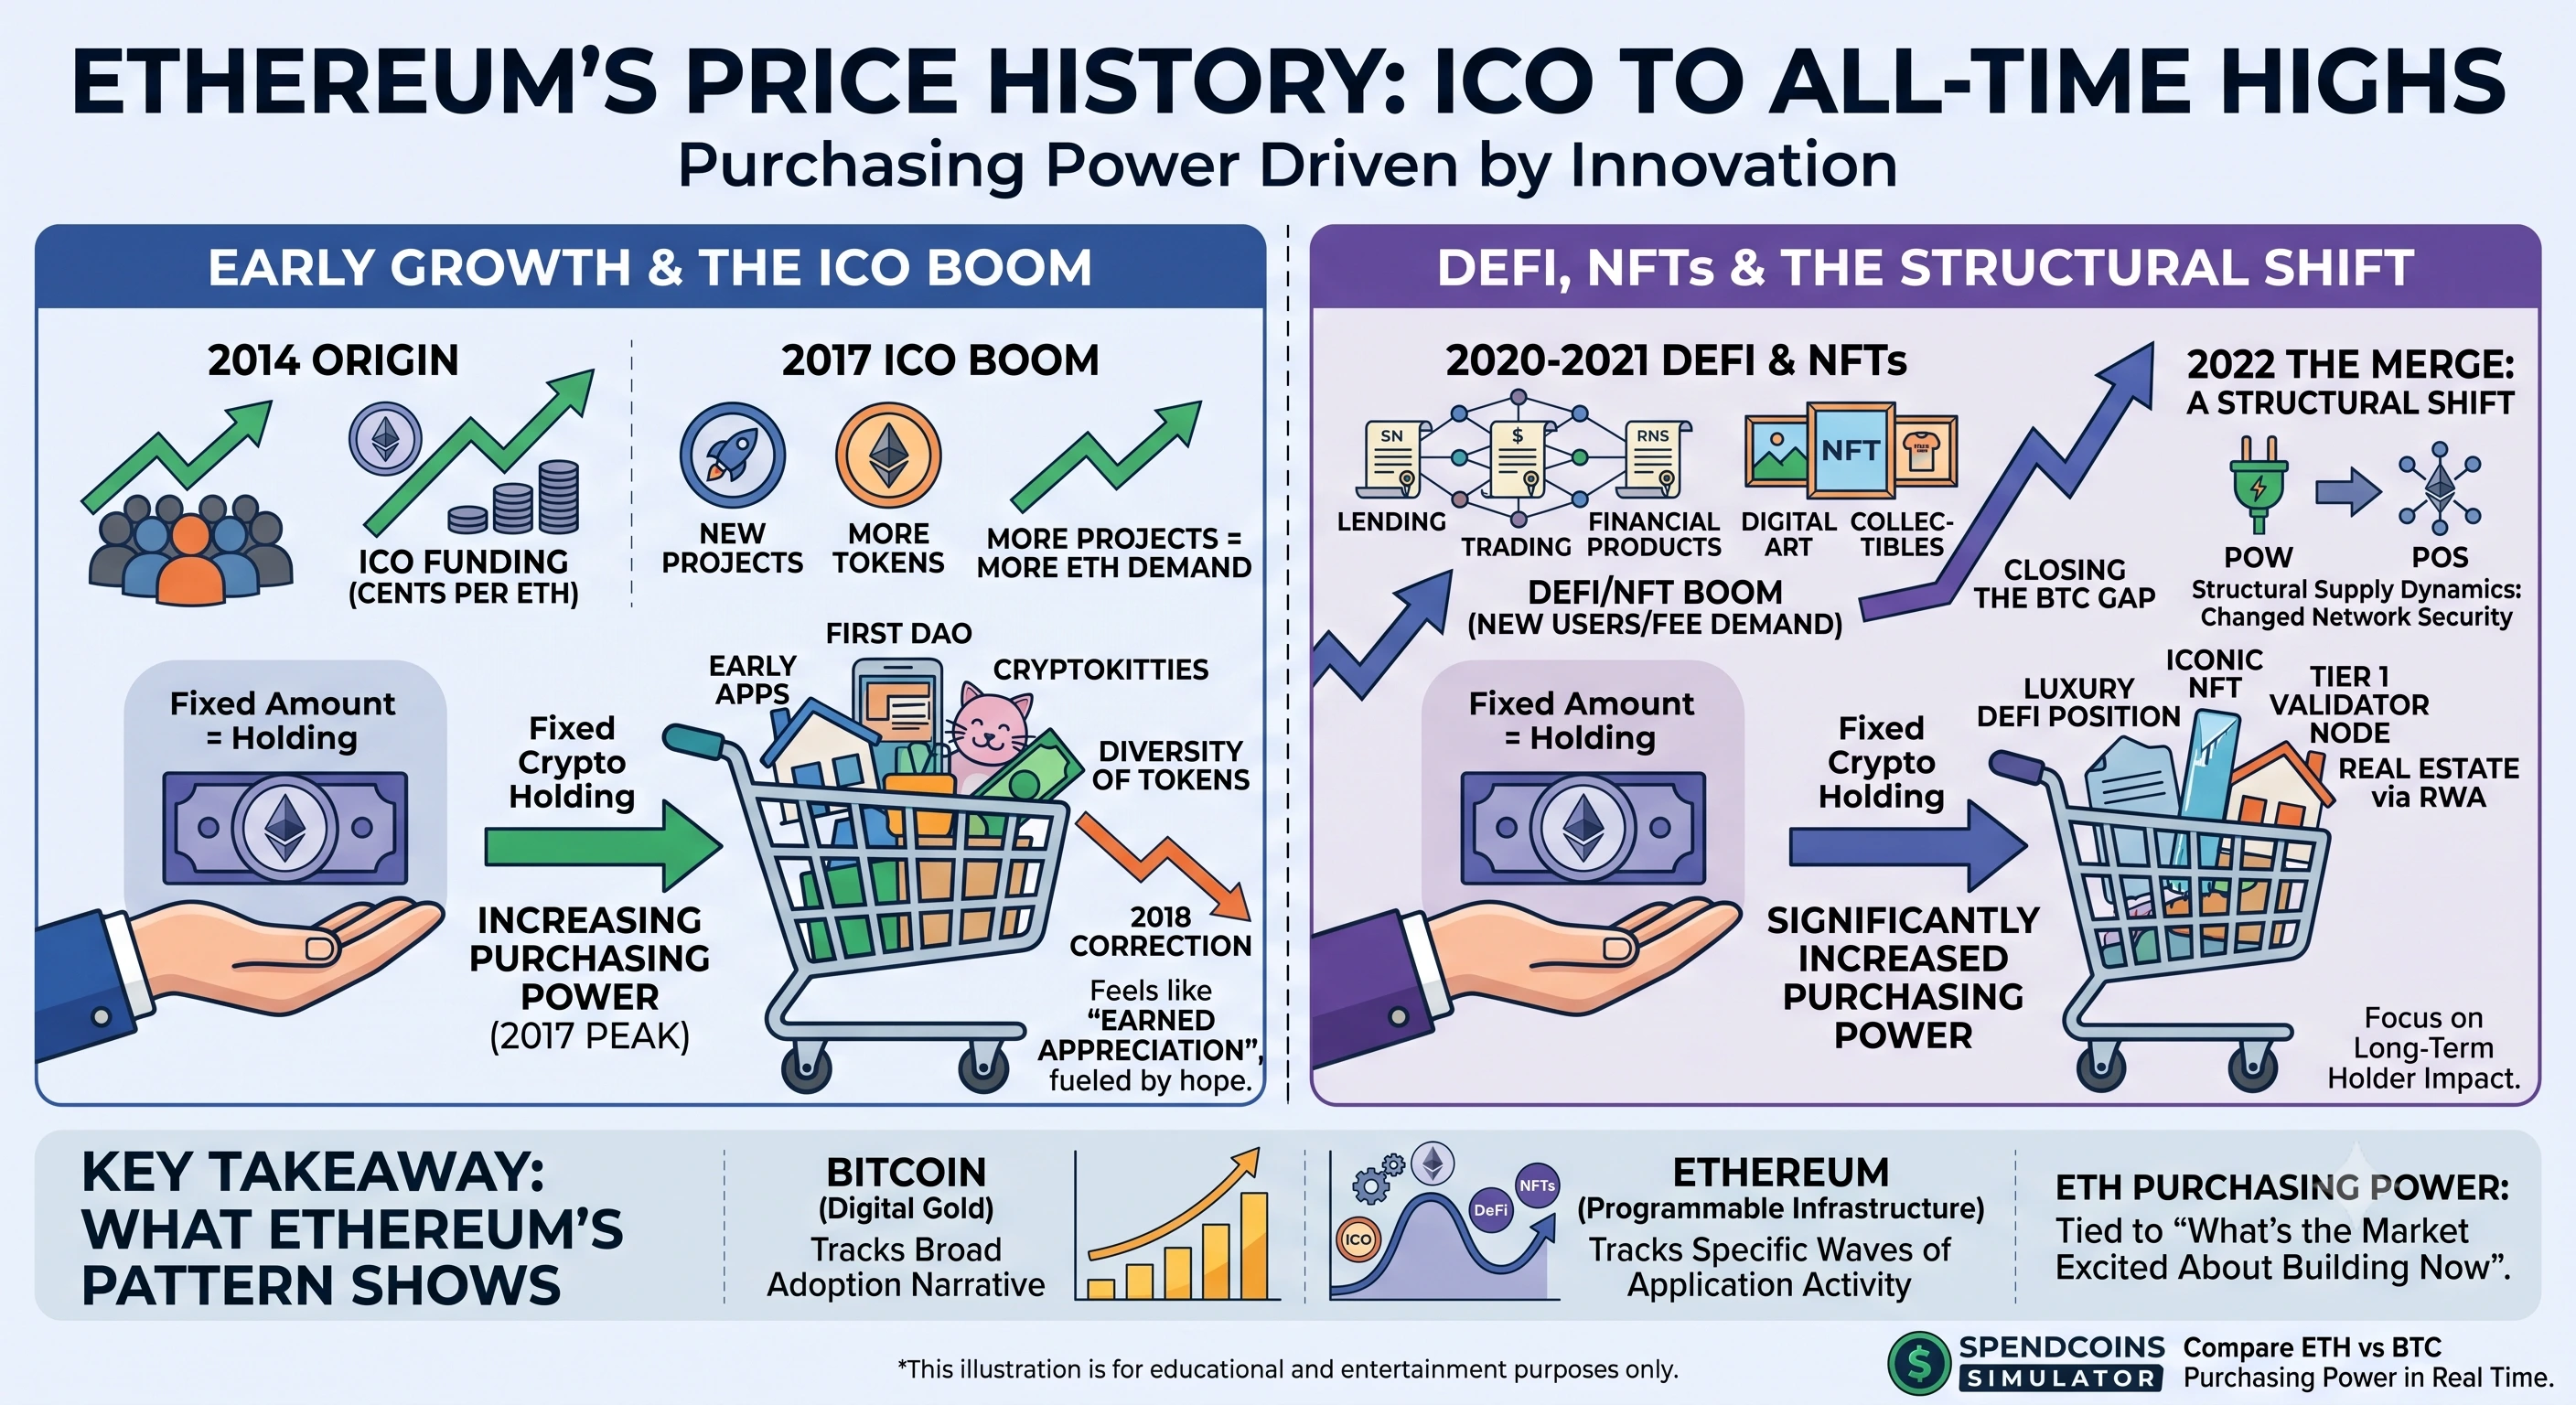
Ethereum's price story runs on a different track than Bitcoin's. Where Bitcoin's narrative is dominated by "digital gold" and scarcity, Ethereum's has been shaped by its role as programmable infrastructure — and its price history reflects the ebb and flow of what people are building, and hoping to build, on top of it.
The 2014 origin: funding an idea
Ethereum wasn't mined into existence the way Bitcoin was — it was funded through one of the earliest and largest token sales (an ICO, or initial coin offering) in 2014, raising funds by selling ETH for a fraction of a cent per coin to fund development of the network. Early participants who held through the years that followed experienced some of the most dramatic purchasing-power growth in crypto history, though it took years of building before the network saw meaningful adoption.
2017: the ICO boom
Ethereum's first major price surge coincided with a wave of new projects launching their own tokens on Ethereum, using it as the base infrastructure. This created reflexive demand — the more projects launched on Ethereum, the more ETH was needed to participate, which pushed Ethereum's own price up alongside the broader 2017 crypto rally. It was also followed by a steep correction through 2018, as many of those projects failed to deliver on their promises.
2020–2021: DeFi and NFTs
Ethereum's most significant growth phase came from two overlapping trends: decentralized finance (DeFi) — lending, trading, and financial products built without traditional intermediaries — and non-fungible tokens (NFTs), which brought a wave of new attention (and new users needing ETH to transact) into the ecosystem. This period pushed Ethereum to new highs and, for a time, meaningfully closed the purchasing-power gap between "what 1 ETH buys" and "what 1 BTC buys" relative to earlier cycles.
Compare ETH vs BTC Live
See how Ethereum's current purchasing power stacks up against Bitcoin at today's prices.
Start Simulation →The Merge: a structural shift, not just a price event
In 2022, Ethereum completed "The Merge" — a transition from one method of securing the network (proof-of-work, similar to Bitcoin's mining) to another (proof-of-stake, which doesn't require energy-intensive mining). This was a major technical milestone rather than a price-driven event, but it changed Ethereum's supply dynamics going forward, which longer-term holders watch closely as a factor in future purchasing-power trends.
What the pattern shows about Ethereum specifically
Compared to Bitcoin's price history, which tracks fairly closely with broad "digital gold" adoption narratives, Ethereum's price history tracks more closely with specific waves of application activity — ICOs, then DeFi, then NFTs. This makes Ethereum's purchasing power somewhat more tied to "what's the market excited about building right now" than Bitcoin's is, which is worth keeping in mind when comparing the volatility and drivers of the two assets side by side.
Compare Ethereum's current purchasing power
Numbers from past cycles are illustrative, but the most useful comparison is a live one. Try entering an ETH amount into the SpendCoins simulator and compare it against BTC at today's prices to see how the relationship between the two currently stands.