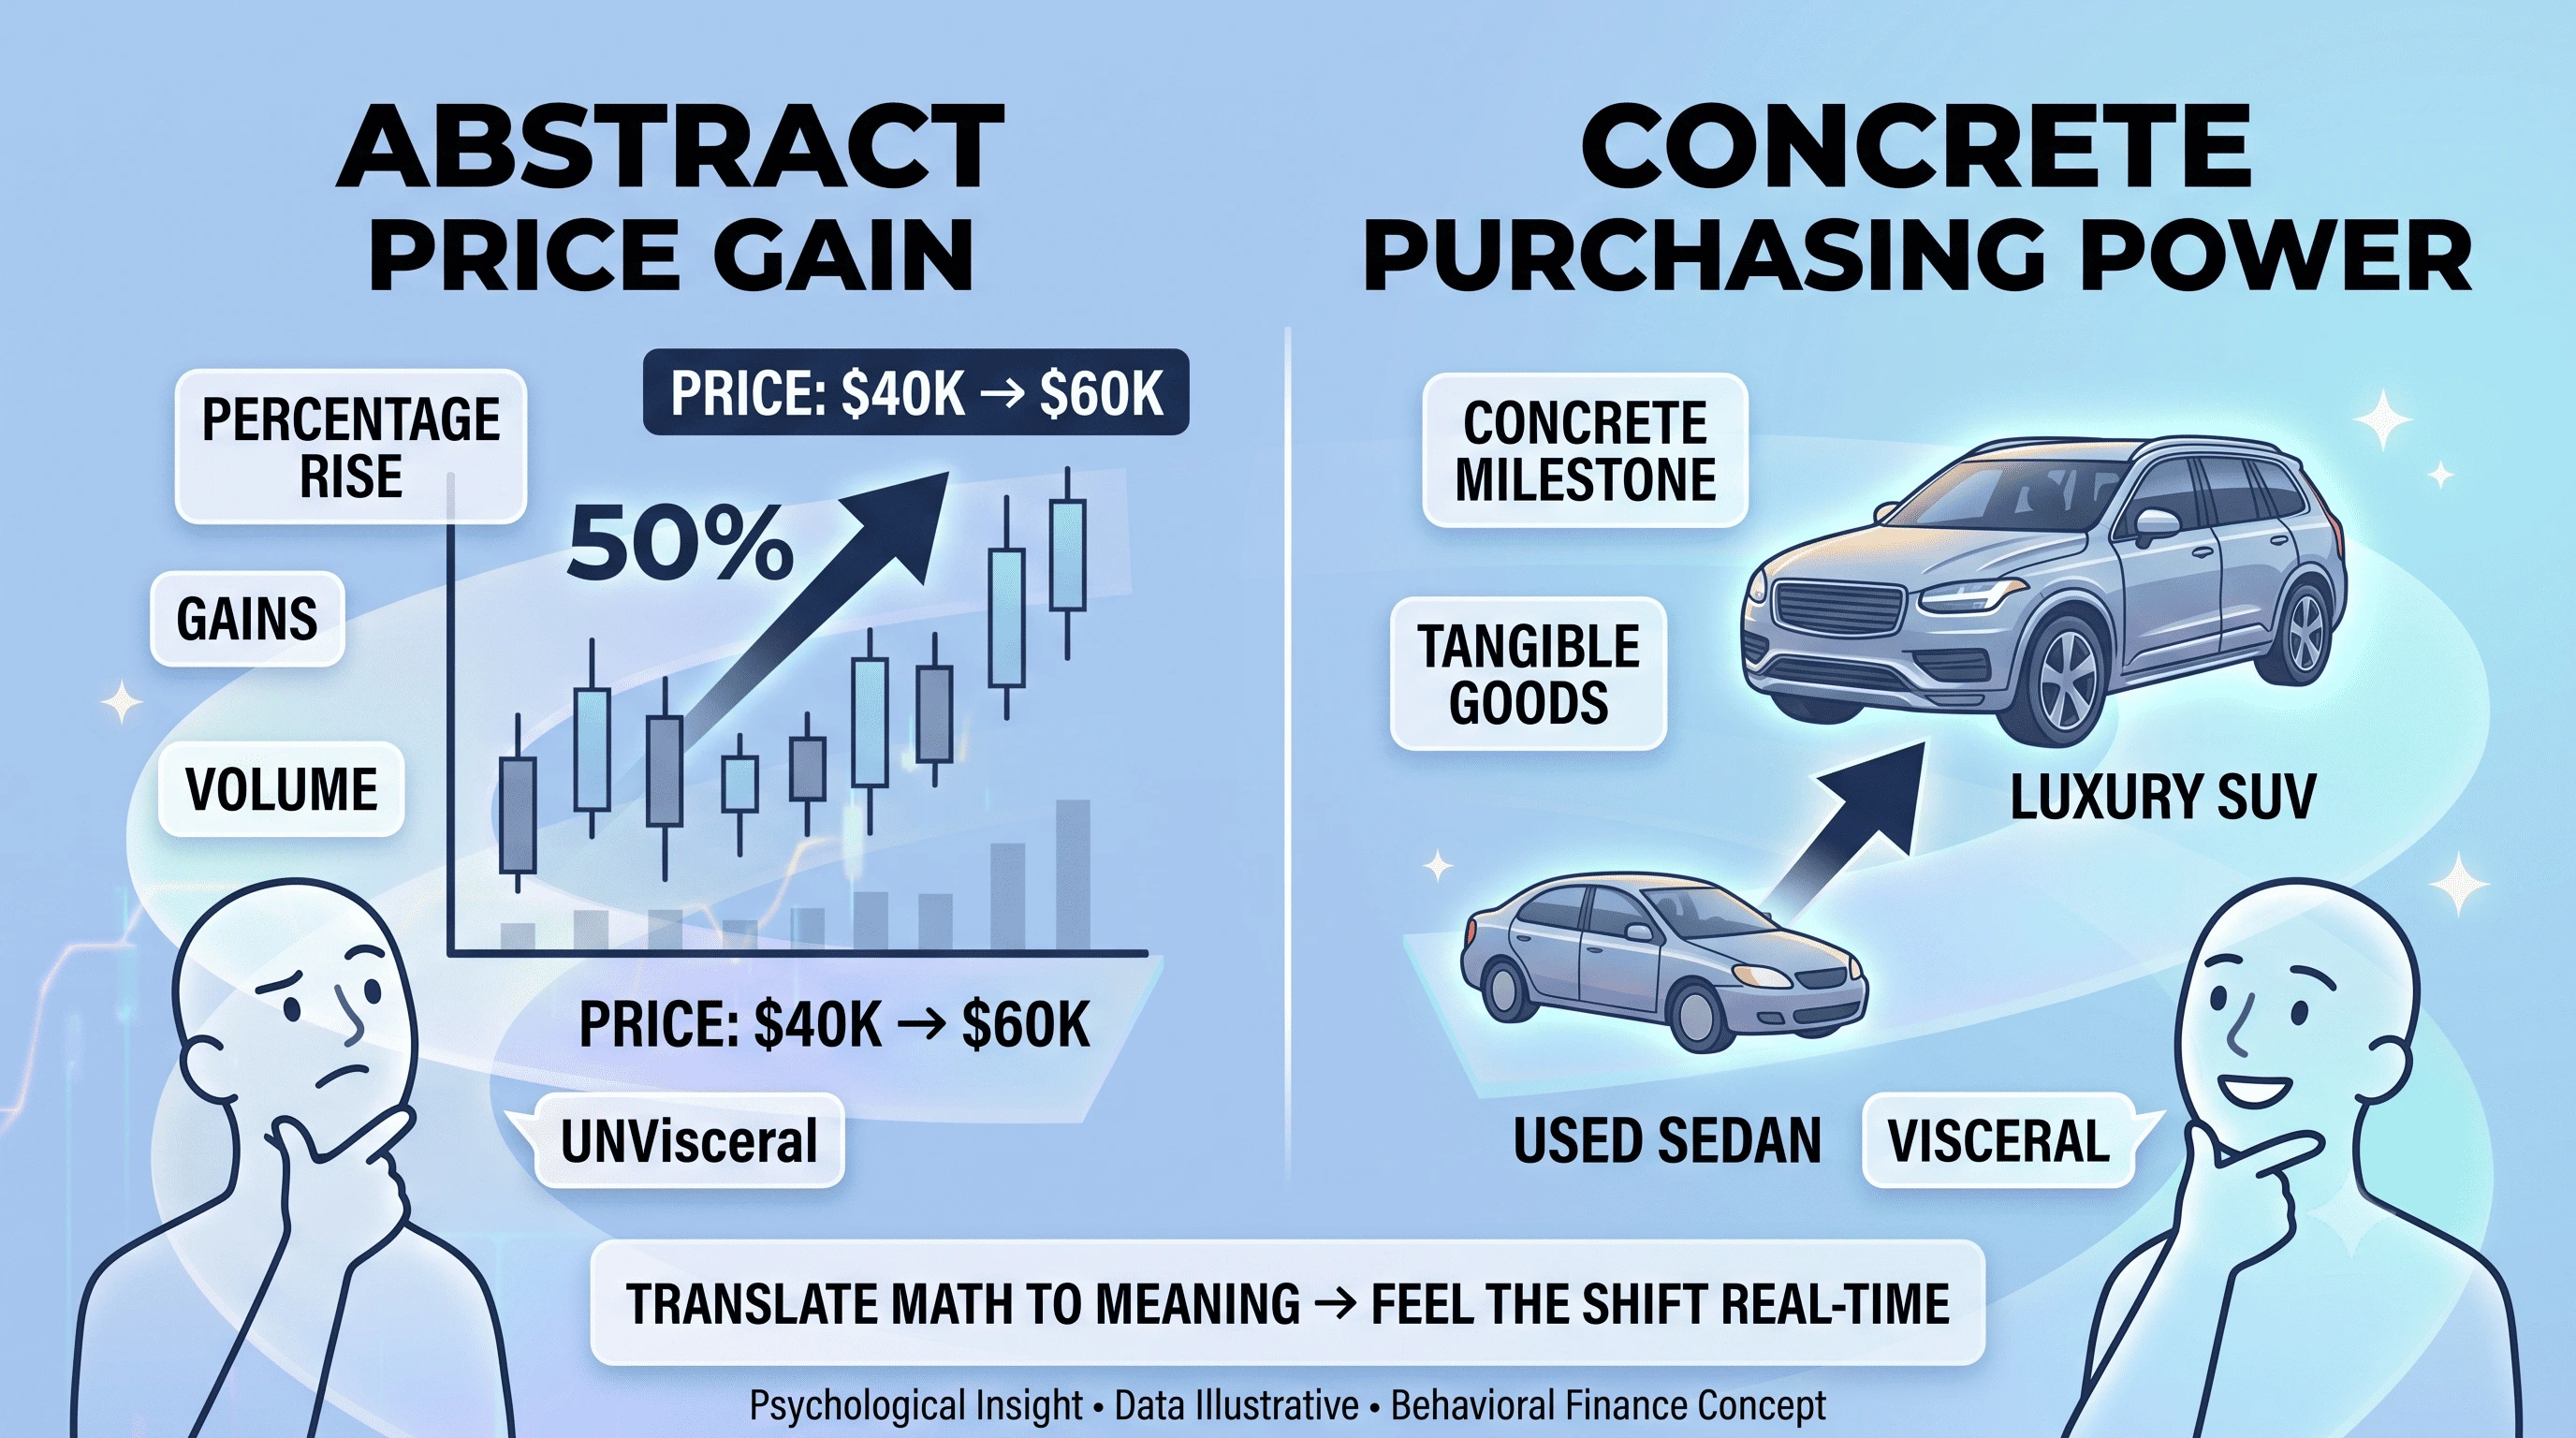
Price charts climbing from $40k to $60k show a 50% gain, but mathematical figures remain abstract. Framing that same gain as moving from a used sedan to a luxury SUV transforms numbers into concrete concepts.
Why abstract numbers feel hollow
Behavioral economics demonstrates that individuals respond more strongly to vivid, visual scenarios than statistical data. Abstract price charts lack immediate visceral connection compared to tangible consumer items.
The car test
Translating gains into real-world assets creates a clear benchmark for risk assessment. Recognizing that a balance covers a specific item grounds decision-making during both market rallies and corrections.
Practical decision-making benefits
Purchasing-power framing clarifies risk tolerance: "this balance covers a car" offers an intuitive milestone for taking profits or rebalancing portfolios.
Understanding the limits of framing
Vivid visual tools cut both ways. Sound purchasing power literacy requires evaluating real-world comparisons objectively without anchoring to market peaks.
Try feeling it yourself
Experience this psychological transition by comparing market chart data against live cart values on the SpendCoins simulator.